Smart University Campuses: How Building and Occupancy Data Can Cut Energy Waste
A practical guide to monitoring campus energy and space use, controlling suitable systems around real demand, and verifying what changes actually deliver.
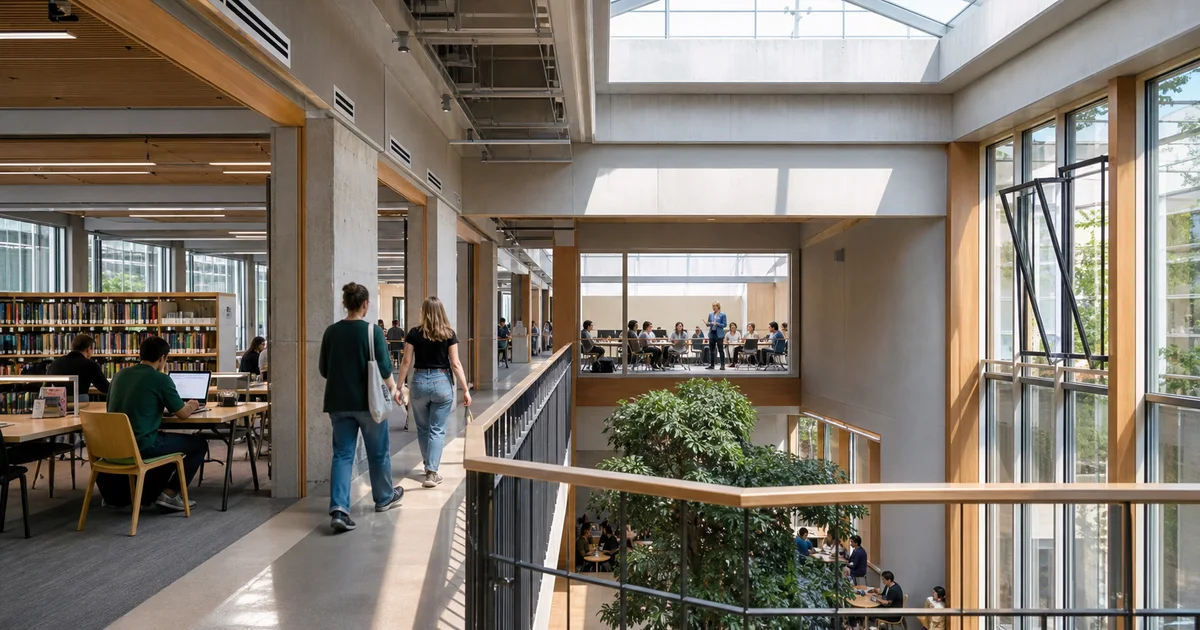
A university timetable can say that a lecture hall is booked from 9am. It cannot confirm that 120 seats are occupied, that the ventilation matches the real load, or that the room was empty after lunch while heating and lighting continued to run.
That gap between assumed demand and actual demand appears across a campus. Libraries fill unevenly. Teaching rooms change use between terms. Administration buildings empty at different times. Water can flow unnoticed overnight. One electricity bill can cover several buildings without showing which system or circuit caused a change.
A smart-campus programme closes that gap in stages:
- Monitor how buildings consume energy and how spaces are used.
- Understand where energy, environmental conditions and demand do not align.
- Control suitable systems around real operating needs.
- Verify whether the change worked.
- Keep monitoring so performance does not drift back.
People counting and presence sensing matter within that model, but they are not the whole offer. The useful outcome comes from connecting occupancy with energy, indoor conditions and the systems that can act on the data.
The Quick Version
- Start with an estates decision or operational problem, not a campus-wide sensor purchase.
- Combine utility and submetering data with occupancy, temperature, humidity and CO₂ where those variables explain demand.
- Treat presence, people counts, room bookings and utilisation as different datasets.
- Use occupancy data to adjust suitable HVAC, ventilation and lighting systems, while preserving comfort, air quality, safety and manual overrides.
- Monitor water and local leak risks as well as electricity and heat.
- Define the baseline and verification method before changing controls.
- Scale only the patterns that work for each type of building.
Why Campus Buildings Need More Than Monthly Bills
University estates are mixed estates. A lecture building, library, laboratory, sports centre and residence do not share one sensible operating profile. Research measuring six types of university building found materially different occupancy schedules across administrative, library, recreation, architecture, research and classroom spaces (Energy and Buildings).
Yet many services still operate from broad time schedules or assumptions about maximum demand. Monthly utility bills show the total cost but cannot explain:
- which building or circuit created an overnight baseload;
- whether HVAC ran for a booking that nobody attended;
- whether a busy room received enough outdoor air;
- whether two timetabled rooms could have been consolidated;
- whether a control change saved energy or merely coincided with warmer weather; or
- where abnormal water use began.
This is why whole-site metering is the start, not the end. Interval data can reveal day types, peaks and out-of-hours demand. Submetering then separates significant buildings, distribution boards, circuits or equipment so an estates team can locate the cause.
The same data-boundary problem appears in multi-let property, where consumption inside leased space may sit behind tenant meters. Our tenant energy-data guide for landlords covers the additional lease, carbon-method and portfolio-reporting requirements.
SEAI’s monitoring and targeting guidance follows the same logic: identify where energy is used, record major consumption, analyse the variables that drive it, establish baselines and act on deviations. More meters alone do not save energy. Useful names, reliable data, clear ownership, alerts and follow-up action do.
Presence, People Counts and Utilisation Are Not the Same
The required detail should follow the decision being made.
| Question | Useful measurement |
|---|---|
| Should lights remain on in this zone? | Presence or absence |
| Should an empty room move to a heating setback? | Presence plus room conditions |
| How much outdoor air does this lecture room need? | Occupant load or a validated proxy, plus CO₂ |
| Is a library area consistently underused? | Counts or seat occupancy over time |
| Should teaching space be reconfigured? | Utilisation patterns combined with timetable and user evidence |
Room bookings are evidence of planned use, not proof of physical use. Presence detection answers a yes-or-no question. People counting estimates a number. Utilisation adds a time dimension and should usually be interpreted alongside timetables and qualitative input.
Universities already use this distinction in estate planning. The University of Edinburgh describes room-utilisation analysis in terms of frequency, occupancy and utilisation across rooms, buildings and campuses. The University of Cambridge’s Education Space Programme combines space data with engagement to assess supply and demand. Neither treats a sensor feed as a complete estate strategy (Edinburgh, Cambridge).
Connect Space Use With Energy Use
Occupancy becomes operationally valuable when it can be compared with the energy and conditions in the same place and period.
Consider a lecture room that appears empty for half of a timetabled block:
- Circuit or plant data shows whether lighting, ventilation and heating continued at their normal occupied level.
- Temperature and humidity show whether a setback would remain comfortable and protect the building.
- CO₂ helps the facilities team assess outdoor-air provision when the room is occupied.
- Door, window or local control states help explain why the system behaved as it did.
- The BEMS records the eventual control change and its result.
The same pattern works at larger scales. A campus dashboard can move from whole-estate totals to buildings, zones and significant loads. Alerts can flag unexpected out-of-hours demand, a schedule override, a threshold breach or performance that no longer matches its baseline.
This is a more useful definition of a smart campus than a collection of connected devices: energy and building data organised around decisions.
From Monitoring to Control
Monitoring tells the estates team where to investigate. Control turns a verified opportunity into a repeatable operating rule.
Depending on the existing plant, interfaces and fitted controllers, campus controls can include:
- occupied and unoccupied temperature setpoints by zone;
- ventilation that responds to occupant load and indoor conditions;
- lighting zones that use presence and daylight rather than a blanket schedule;
- remote switching of appropriate loads;
- alerts for open doors or windows while conditioning is active;
- peak-load management; and
- holiday, event and out-of-hours schedules that reflect real campus use.
This is not permission to automate every load. Laboratories, specialist teaching rooms, residences, catering and sports facilities have distinct process, safety, ventilation and comfort requirements. Even within a teaching building, pre-heating, accessibility, cleaning, frost protection and manual overrides must be designed into the control sequence.
Published research also argues against promising a universal percentage. One field study of occupancy-responsive HVAC in university residences recorded heating reductions of 5–8% and cooling reductions of 0–9% during normal academic operation, with larger cooling effects during sparsely occupied periods. The authors found that vacancy patterns and whole-building system behaviour strongly affected the outcome (Energy and Buildings).
The credible promise is a process: find the mismatch, control what is suitable and measure the result on that campus.
Ventilation Must Follow Demand Without Sacrificing Air Quality
Variable occupancy makes fixed ventilation difficult. A lecture hall may move from nearly empty to full between periods, while a library changes more gradually through the day.
CO₂, temperature and humidity monitoring can show when an occupied room is operating outside its intended conditions. CO₂ is particularly useful as a ventilation-related indicator in occupied spaces, but it is not a complete air-quality score and it is influenced by both people and outdoor-air supply.
Demand-controlled ventilation can adjust airflow around actual need where the plant supports it. A controlled study in university computer classrooms found that CO₂-controlled variable ventilation reduced time above 1,000 ppm compared with constant flow and improved perceived air quality (International Archives of Occupational and Environmental Health).
The control objective is therefore two-sided: avoid ventilating an empty space at full design demand, and provide sufficient outdoor air when people are present. An energy-only control that compromises indoor environmental quality is not optimisation.
Bring Water and Building Risk Into the Same View
Energy is not the only utility that benefits from a time profile. Regular water-meter readings can expose abnormal or out-of-hours use, a practice recommended by Uisce Éireann.
Campus risk needs more than one layer:
- Utility or submeter data can identify unusual flow trends.
- Local leak sensors can detect water at high-risk points.
- Automated alerts can shorten the time between detection and response.
- Shut-off control may be appropriate for defined systems where a safe sequence has been engineered.
- Escalation and maintenance procedures determine whether anyone acts.
A sensor does not prevent damage by itself. Its value lies in a complete response path—from measurement to alert, owner and action.
Privacy by Design, Not by Slogan
Campus occupancy data can create justified concern if its purpose and boundaries are unclear. The first design question should be: what is the least intrusive measurement that can support this decision?
A lighting zone may need only an occupied or unoccupied state. Space-capacity planning may need anonymous aggregate counts. Neither necessarily requires identifiable video or a record of where a particular student went.
European Commission GDPR guidance emphasises purpose limitation, data minimisation, retention limits and appropriate safeguards, and recommends anonymous data where feasible (processing principles, data minimisation).
For a university deployment, that means documenting:
- the operational purpose;
- whether the data can identify or single out anyone;
- the lawful basis and responsible roles;
- who can access the data;
- how long it is retained;
- how it is secured and explained to campus users; and
- whether a data-protection impact assessment is required.
“GDPR compliant” is not an inherent feature of a sensor. Compliance depends on the complete technology, purpose and processing arrangement. Universities should involve their data-protection officer early, especially where existing Wi-Fi, access-control or video data is being considered.
A Practical Campus Pilot
A useful pilot begins with a question and a measurement plan.
1. Select a bounded problem
Choose representative buildings or zones with an operational owner. Examples include out-of-hours electricity in one teaching building, ventilation mismatch in several lecture rooms, library utilisation or unexplained water flow.
2. Define the measurement boundary
Decide which meters, circuits, rooms, plant and time periods belong to the pilot. Record the decision the data is intended to support.
3. Establish a baseline
Capture enough energy, occupancy, indoor-condition, weather, timetable and operational data to represent a normal cycle. Note holidays, events and known faults.
4. Investigate before automating
Check sensor accuracy, BMS points, schedules, overrides and plant constraints. Confirm that a mismatch is avoidable rather than necessary for safety, process or comfort.
5. Introduce bounded controls
Change only suitable systems and zones. Commission the sequence, retain appropriate overrides and monitor indoor conditions as well as energy.
6. Verify the result
Energy savings are avoided consumption, so they cannot be read directly from one meter. Compare the reporting period with the baseline using a defined boundary and adjustments for relevant changes such as weather, timetable or occupancy. The International Performance Measurement and Verification Protocol provides the recognised framework.
7. Retain monitoring and scale carefully
Watch for drift, overrides, faults and changed room use. Expand only after documenting what worked, under which conditions and what must change for another building type.
Where Optim EOS Fits
Optim EOS is Optim Energy’s Building Energy Management System (BEMS). It brings meters, sensors, controllers and gateways into one operating view designed around the building and its systems. Our dedicated university use case shows how that operating model can be scoped across a mixed campus estate.
For a university campus, that can include:
- whole-site, building, circuit and equipment energy monitoring;
- temperature, humidity, CO₂, occupancy, footfall, doors and water;
- dashboards, thresholds and anomaly alerts across multiple buildings;
- control of suitable HVAC, lighting and connected loads; and
- baselines and reporting that help the estates team verify changes.
The important word is suitable. Existing plant, protocols, interfaces and operational constraints determine what can be monitored or controlled. A staged design can begin with visibility, prove the priority opportunities and add control where the evidence supports it.
The Smart Campus Is a Management Practice
A university does not become smart when it installs people counters. It becomes better managed when estates teams can connect what the campus expected to happen, what actually happened, what energy and conditions resulted, and what action followed.
Start with one decision. Measure the relevant demand and consumption. Control the systems that can respond safely. Verify the outcome. Then carry the proven pattern into the next building.
That is how occupancy data becomes more than a dashboard—and how campus monitoring becomes durable energy management.